> ## Documentation Index
> Fetch the complete documentation index at: https://www.bolna.ai/docs/llms.txt
> Use this file to discover all available pages before exploring further.
# How to Read the Call Analytics Dashboard
> See how your calls perform on Bolna: how many calls are completed, how many become real conversations, and the best day of the week and hour to call.
The Call Analytics dashboard shows how your calls perform. Use it to answer three questions:
1. **How many of my calls are completed (connected)?**
2. **How many completed calls become real conversations (two-way conversations of 30 seconds or more)?**
3. **What is the best day of the week and hour to call?**
To open it, go to [platform.bolna.ai/analytics](https://platform.bolna.ai/analytics), or click **Monitor → Analytics** in the left navigation menu.
The dashboard counts phone calls only, both outbound and inbound. Web calls, such as testing an agent in your browser, are not included.
***
## What you can use it for
| If you want to… | Look at |
| - | - |
| Check how many of your calls actually got through | [Call Results](#call-results-did-the-call-get-through) |
| Find the step where you lose most people, from dialing to a real conversation | [Call Funnel](#call-funnel-from-dialed-to-a-real-conversation) |
| Plan your [batch calls](/docs/outbound/batch-calling) for the days and hours that work best | [Best Day and Hour to Call](#best-day-and-hour-to-call) |
| See when people stay on the line the longest | [Average Call Duration](#average-call-duration) |
| Know how many **people** you reached, not just how many calls you made | The [Unique Numbers](#all-calls-or-unique-numbers) tab |
| Compare one date range with another, or one agent or sub-account with another (if your account has those filters) | The [filters](#filter-the-dashboard) |
***
## All Calls or Unique Numbers
At the top of the dashboard there are two tabs. Both show the same four charts, but they count in different ways.
* **All Calls** counts every call. If you call the same number 3 times, that is 3 calls. Use it to see how your calling effort performs.
* **Unique Numbers** counts each phone number once, however many times you called it. Use it to see how many **people** you reached.
**Simple example.** You call a person 3 times. The line is busy twice, and the third call is completed.
| Tab | Dialed | Completed |
| - | - | - |
| **All Calls** | 3 calls | 1 call |
| **Unique Numbers** | 1 number | 1 number |
**Furthest stage example.** You call Priya 3 times:
* Call 1: the line is busy.
* Call 2: the call connects, but it ends before she says anything.
* Call 3: the call connects and she talks with your agent for 45 seconds.
| Tab | Dialed | Completed | Real conversation |
| - | - | - | - |
| **All Calls** | 3 calls | 2 calls | 1 call |
| **Unique Numbers** | 1 number | 1 number | 1 number |
In **Unique Numbers**, Priya is counted once, at the furthest stage any of her calls reached. Her third call became a real conversation, so she counts as one real conversation, even though her other two calls did not.
***
## Filter the dashboard
Use the filter bar below the tabs to focus on the calls you care about. Every filter applies to every chart on the dashboard.
The filters you see depend on your account:
* **Self-serve accounts** have one filter, **Date**.
* **Other accounts** have **Date**, and may also have **Agent Id** and **Sub Acc ID**, depending on how the account is set up.
| Filter | Use it to |
| - | - |
| **Date** | Choose the time period. It starts at **Previous 7 days**. |
| **Agent Id** | Show calls made or received by one agent. |
| **Sub Acc ID** | Show calls from one sub-account. |
For example, set **Date** to the last 30 days to see how your calls performed this month. If you have the **Agent Id** filter, pick your sales agent as well to see only that agent's calls.
***
## Call Results: did the call get through?
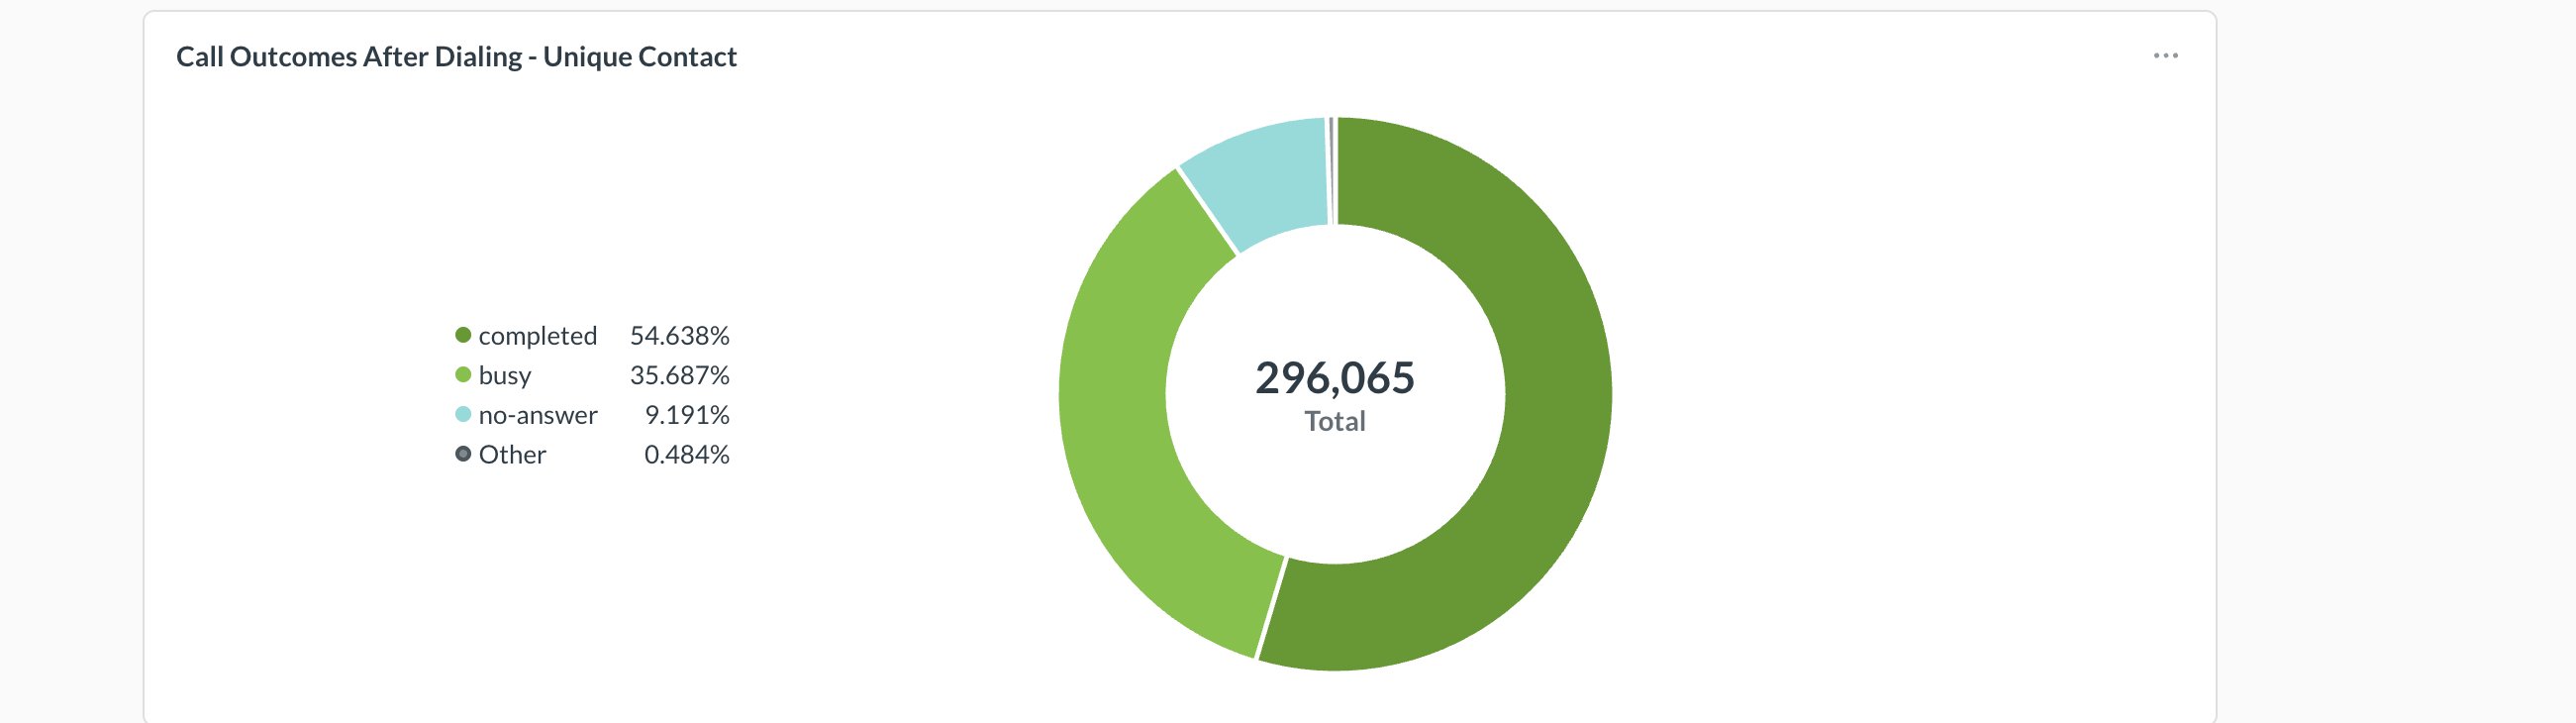
The first chart, **Call Outcomes After Dialing**, shows what happened each time a call was placed. The number in the centre is the total, and each slice is one result.
 | Result on the chart | What it means |
| - | - |
| **completed** | The call got connected. |
| **busy** | The line was busy, or the person declined the call. |
| **no-answer** | The phone rang, but nobody picked up. |
| **failed** | The call could not be connected. |
Results that make up only a very small share of calls are grouped together as **Other**.
In the **Unique Numbers** tab, each number shows its best result across all its calls. From best to worst, the order is **completed**, **busy**, **no-answer**, **failed**. For example, a number that did not pick up twice and then got connected on the third call counts as **completed**.
**Use it to:** spot a reachability problem. If a large share of calls are **busy** or **no-answer**, try calling at a different time. The [Best Day and Hour to Call](#best-day-and-hour-to-call) chart shows which times work better.
***
## Call Funnel: from dialed to a real conversation
The Call Results chart tells you whether a call was completed. The **Call Funnel** shows what happened next: did the completed call turn into a real conversation?
The funnel has five steps. A call only reaches a step if it passed every step before it, so the numbers get smaller from left to right.
| Result on the chart | What it means |
| - | - |
| **completed** | The call got connected. |
| **busy** | The line was busy, or the person declined the call. |
| **no-answer** | The phone rang, but nobody picked up. |
| **failed** | The call could not be connected. |
Results that make up only a very small share of calls are grouped together as **Other**.
In the **Unique Numbers** tab, each number shows its best result across all its calls. From best to worst, the order is **completed**, **busy**, **no-answer**, **failed**. For example, a number that did not pick up twice and then got connected on the third call counts as **completed**.
**Use it to:** spot a reachability problem. If a large share of calls are **busy** or **no-answer**, try calling at a different time. The [Best Day and Hour to Call](#best-day-and-hour-to-call) chart shows which times work better.
***
## Call Funnel: from dialed to a real conversation
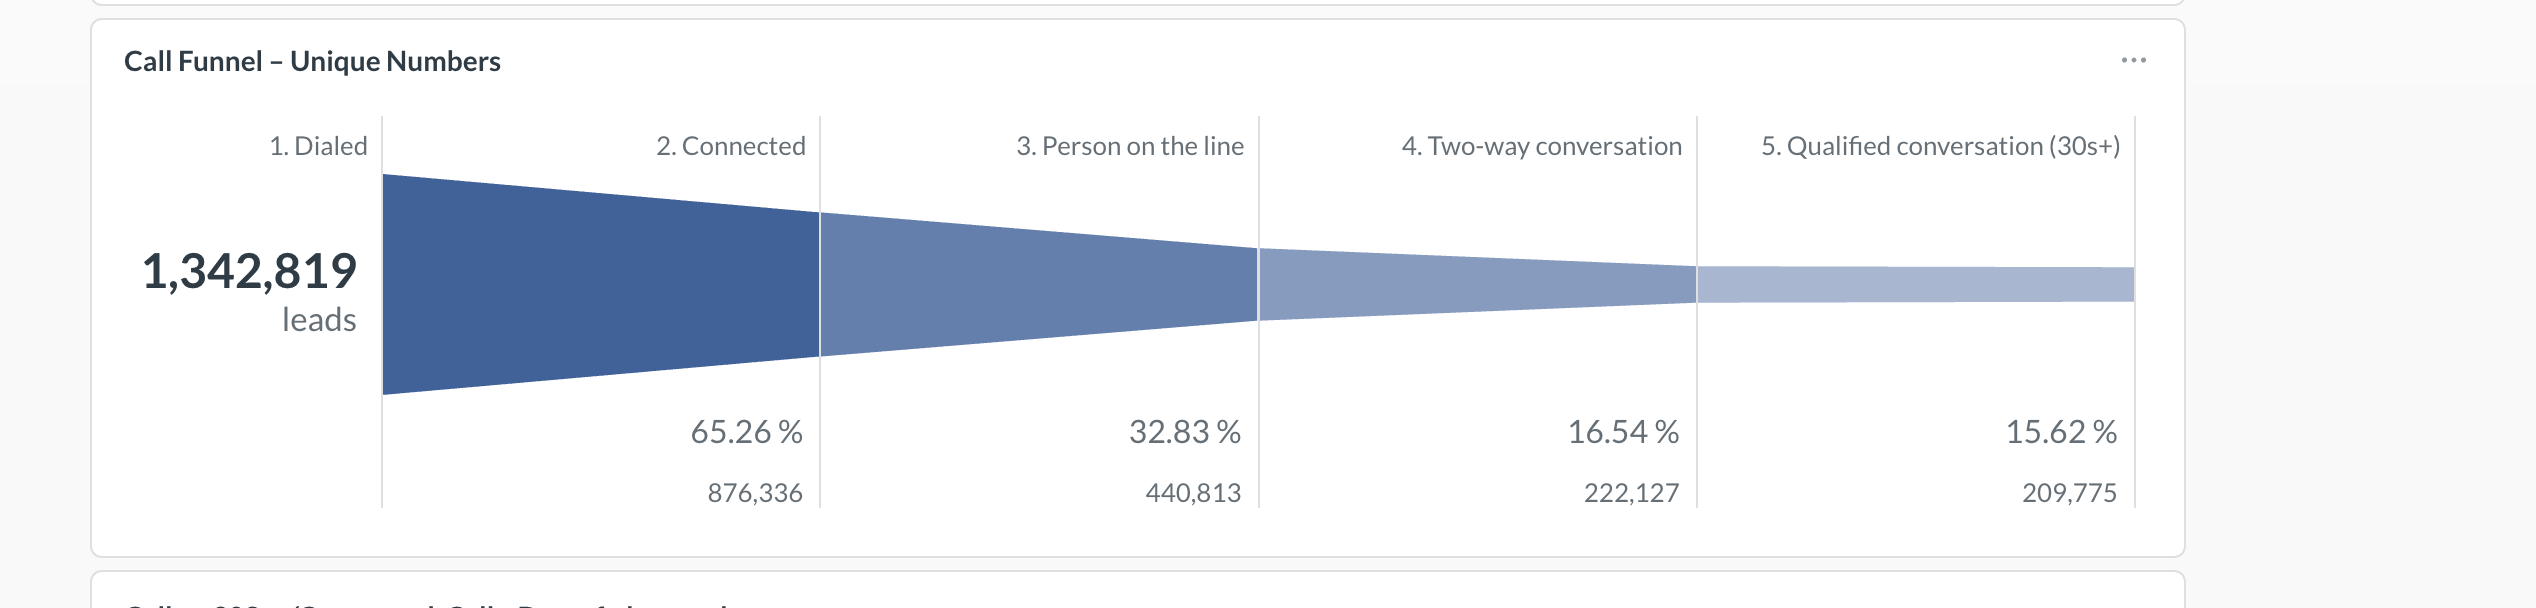
The Call Results chart tells you whether a call was completed. The **Call Funnel** shows what happened next: did the completed call turn into a real conversation?
The funnel has five steps. A call only reaches a step if it passed every step before it, so the numbers get smaller from left to right.
 | Step | What it tells you |
| - | - |
| **1. Dialed** | The call was placed. |
| **2. Connected** | The call got connected (**completed**). |
| **3. Person on the line** | The person actually spoke. Silence or unclear audio does not count. |
| **4. Two-way conversation** | The person kept replying to your agent. |
| **5. Qualified conversation (30s+)** | That conversation lasted 30 seconds or more. This is a real conversation. |
### Reading the numbers
Each step shows two numbers: a **percentage** and a **count**. The percentage is always out of the total **Dialed**.
In the example above, 1,342,819 leads were dialed and 876,336 of them were completed, so **Connected** shows **65.26%**. At the end of the funnel, 209,775 leads (15.62% of everyone dialed) had a real conversation.
**Use it to:** find the biggest drop between two steps. For example, if many calls are completed but far fewer reach **Person on the line** or **Two-way conversation**, people are hanging up early. Review how your agent opens the call.
### SIP calls are checked differently
**SIP calls** are calls placed through your own phone lines using a [SIP trunk](/docs/sip-trunking/introduction). **Non-SIP calls** are all other calls.
**Dialed** and **Connected** (steps 1 and 2) work the same way for every call.
Steps 3 to 5 depend on what was said on the call:
* For **non-SIP calls**, Bolna checks the **call audio**.
* For **SIP calls**, the call audio is not available for analysis, so Bolna checks the **call transcript** instead.
So the rules for steps 3 to 5 are slightly different. They apply in both tabs, and the [Best Day and Hour to Call](#best-day-and-hour-to-call) chart uses the same rule for a real conversation.
| Step | Non-SIP calls (checked using the call audio) | SIP calls (checked using the call transcript) |
| - | - | - |
| **1. Dialed** | The call was placed. | Same as non-SIP. |
| **2. Connected** | The call got connected. | Same as non-SIP. |
| **3. Person on the line** | The person talked for at least 3 seconds with clear audio. | The person replied at least once. |
| **4. Two-way conversation** | The person replied 3 or more times. | The person replied 2 or more times. |
| **5. Qualified conversation (30s+)** | A two-way conversation (3 or more replies) where the call lasted 30 seconds or more. | 2 or more replies, and the call lasted 30 seconds or more. |
A SIP call needs fewer replies than a non-SIP call to reach steps 4 and 5. Keep this in mind when you compare the funnels of SIP and non-SIP agents.
***
## Best Day and Hour to Call
This chart shows **when** your completed calls are most likely to become real conversations.
It is a grid. Each **row** is a day of the week and each **column** is an hour of the day. Each cell shows the **percentage of completed calls that became a real conversation** (a two-way conversation of 30 seconds or more) on that day and hour. For SIP calls, that means 2 or more replies and a call of 30 seconds or more.
| Step | What it tells you |
| - | - |
| **1. Dialed** | The call was placed. |
| **2. Connected** | The call got connected (**completed**). |
| **3. Person on the line** | The person actually spoke. Silence or unclear audio does not count. |
| **4. Two-way conversation** | The person kept replying to your agent. |
| **5. Qualified conversation (30s+)** | That conversation lasted 30 seconds or more. This is a real conversation. |
### Reading the numbers
Each step shows two numbers: a **percentage** and a **count**. The percentage is always out of the total **Dialed**.
In the example above, 1,342,819 leads were dialed and 876,336 of them were completed, so **Connected** shows **65.26%**. At the end of the funnel, 209,775 leads (15.62% of everyone dialed) had a real conversation.
**Use it to:** find the biggest drop between two steps. For example, if many calls are completed but far fewer reach **Person on the line** or **Two-way conversation**, people are hanging up early. Review how your agent opens the call.
### SIP calls are checked differently
**SIP calls** are calls placed through your own phone lines using a [SIP trunk](/docs/sip-trunking/introduction). **Non-SIP calls** are all other calls.
**Dialed** and **Connected** (steps 1 and 2) work the same way for every call.
Steps 3 to 5 depend on what was said on the call:
* For **non-SIP calls**, Bolna checks the **call audio**.
* For **SIP calls**, the call audio is not available for analysis, so Bolna checks the **call transcript** instead.
So the rules for steps 3 to 5 are slightly different. They apply in both tabs, and the [Best Day and Hour to Call](#best-day-and-hour-to-call) chart uses the same rule for a real conversation.
| Step | Non-SIP calls (checked using the call audio) | SIP calls (checked using the call transcript) |
| - | - | - |
| **1. Dialed** | The call was placed. | Same as non-SIP. |
| **2. Connected** | The call got connected. | Same as non-SIP. |
| **3. Person on the line** | The person talked for at least 3 seconds with clear audio. | The person replied at least once. |
| **4. Two-way conversation** | The person replied 3 or more times. | The person replied 2 or more times. |
| **5. Qualified conversation (30s+)** | A two-way conversation (3 or more replies) where the call lasted 30 seconds or more. | 2 or more replies, and the call lasted 30 seconds or more. |
A SIP call needs fewer replies than a non-SIP call to reach steps 4 and 5. Keep this in mind when you compare the funnels of SIP and non-SIP agents.
***
## Best Day and Hour to Call
This chart shows **when** your completed calls are most likely to become real conversations.
It is a grid. Each **row** is a day of the week and each **column** is an hour of the day. Each cell shows the **percentage of completed calls that became a real conversation** (a two-way conversation of 30 seconds or more) on that day and hour. For SIP calls, that means 2 or more replies and a call of 30 seconds or more.
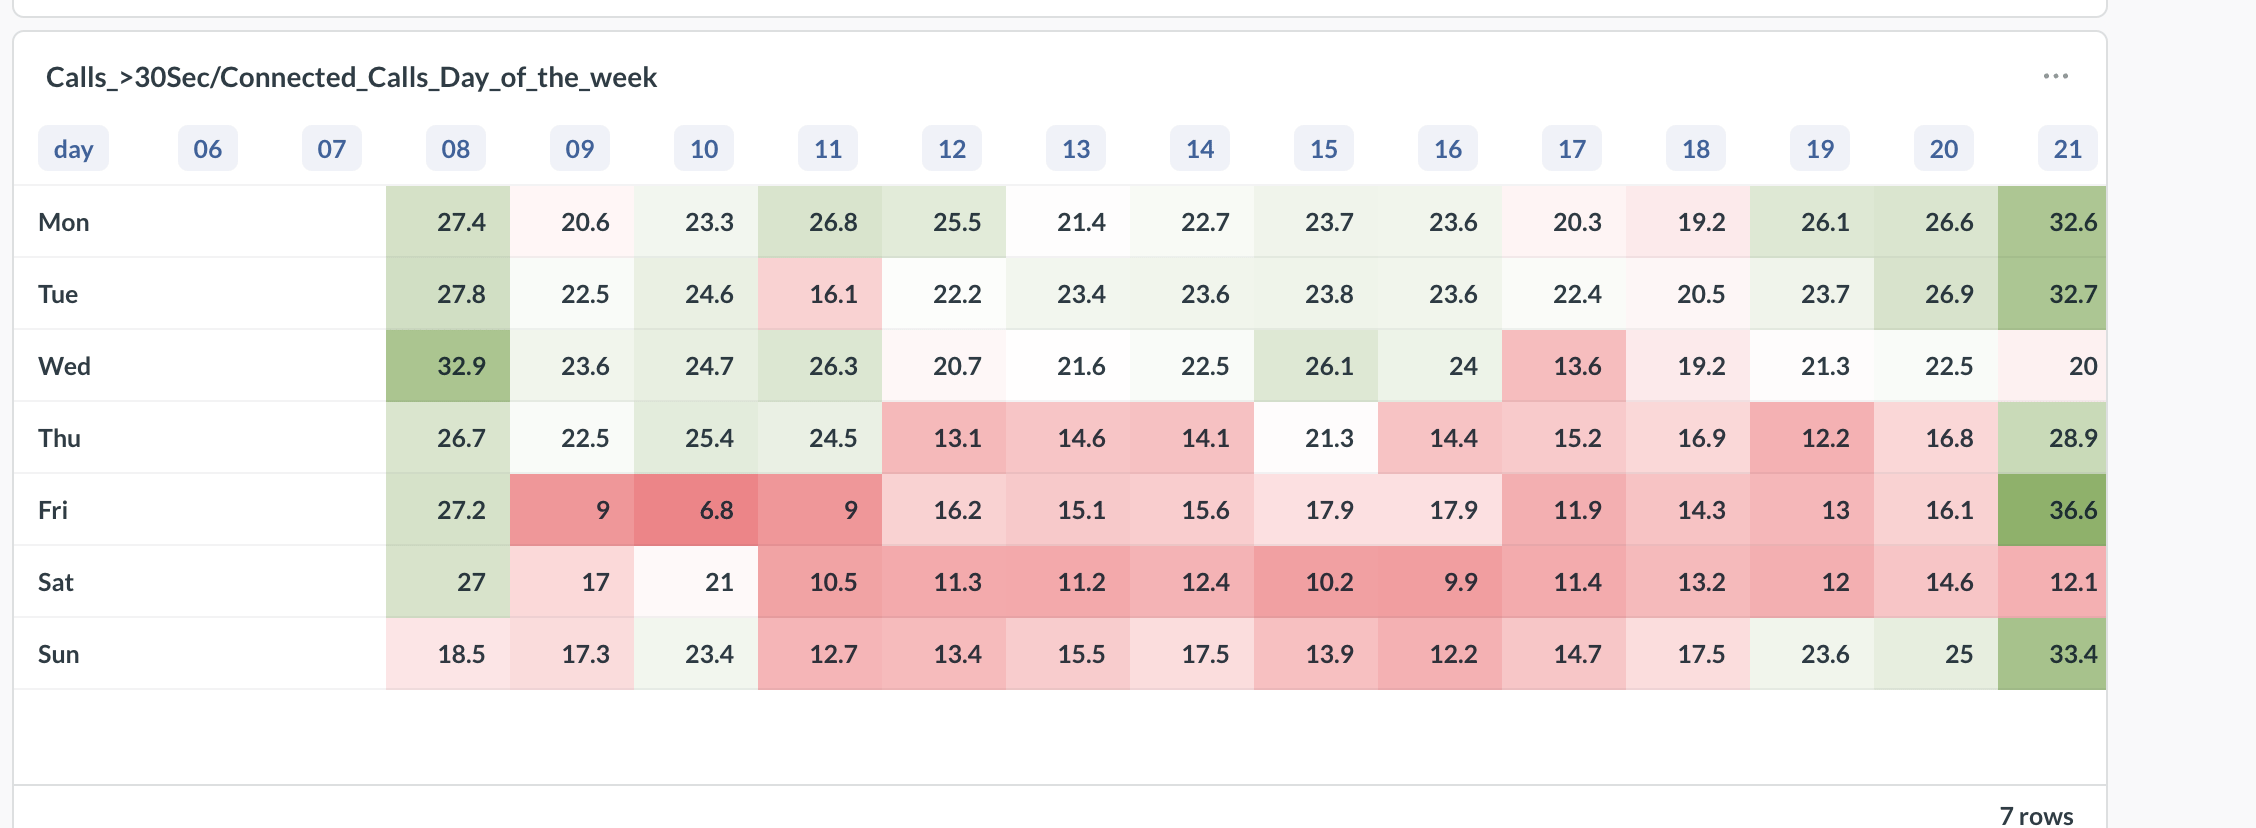 A **higher** percentage means a **better** time to call. Green cells are your best times and red cells are your worst.
For example, the cell for **Fri** at **21** shows **36.6**. That means 36.6% of calls completed on Fridays between 9 PM and 10 PM became real conversations.
In the **Unique Numbers** tab, each number is counted once per hour, so calling the same person many times does not skew the result. A number counts as a real conversation for that hour if any of its completed calls in that hour was one.
**Use it to:** schedule your [batch calls](/docs/outbound/batch-calling) in the green slots, and set your agent's [calling guardrails](/docs/outbound/calling-guardrails) to avoid the red ones.
***
## Average Call Duration
This chart uses the same day-by-hour grid. Each cell shows **how long completed calls lasted on average, in seconds**, on that day and hour. A longer average usually means people stayed on the line and engaged more with your agent.
A **higher** percentage means a **better** time to call. Green cells are your best times and red cells are your worst.
For example, the cell for **Fri** at **21** shows **36.6**. That means 36.6% of calls completed on Fridays between 9 PM and 10 PM became real conversations.
In the **Unique Numbers** tab, each number is counted once per hour, so calling the same person many times does not skew the result. A number counts as a real conversation for that hour if any of its completed calls in that hour was one.
**Use it to:** schedule your [batch calls](/docs/outbound/batch-calling) in the green slots, and set your agent's [calling guardrails](/docs/outbound/calling-guardrails) to avoid the red ones.
***
## Average Call Duration
This chart uses the same day-by-hour grid. Each cell shows **how long completed calls lasted on average, in seconds**, on that day and hour. A longer average usually means people stayed on the line and engaged more with your agent.
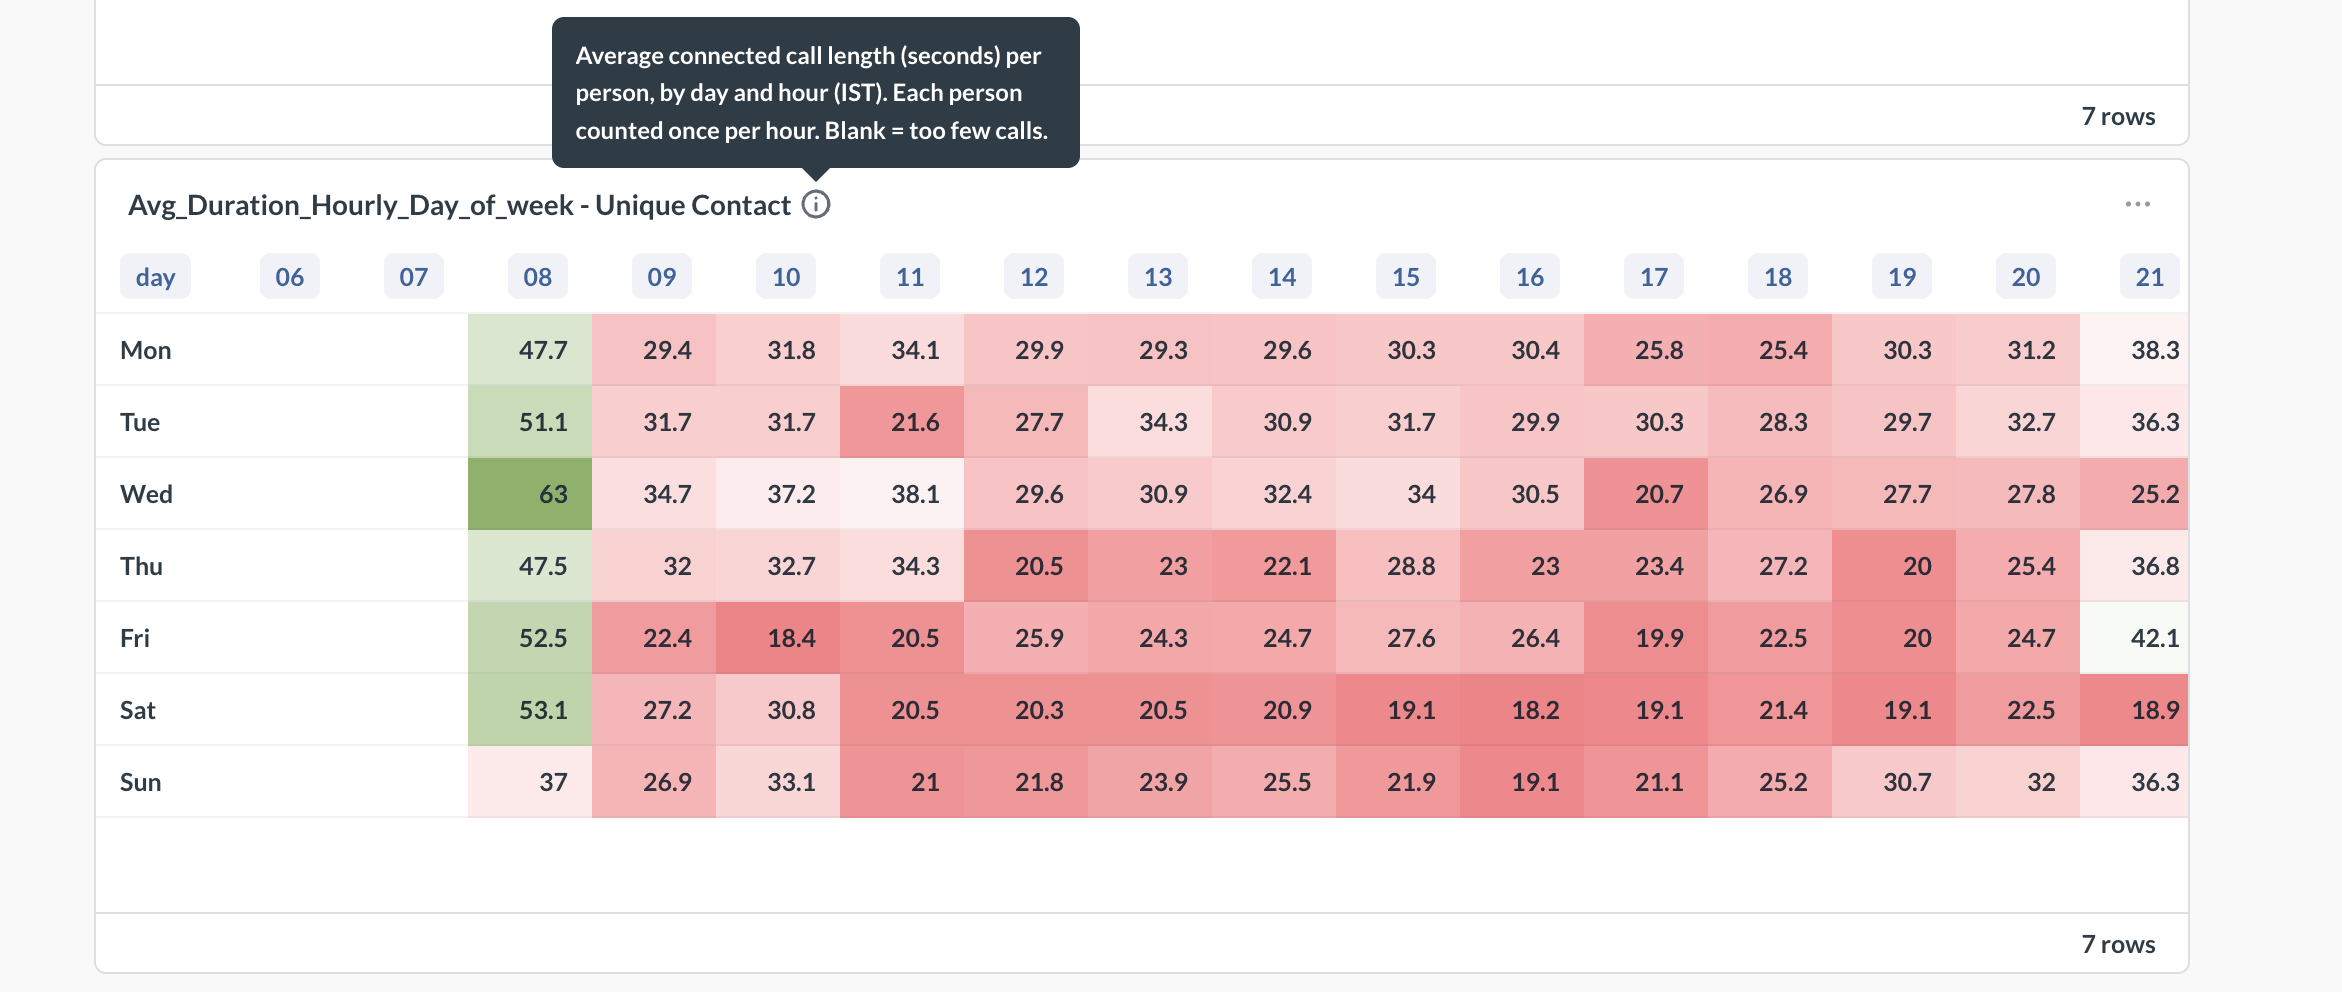 For example, the cell for **Wed** at **08** shows **63**. That means completed calls on Wednesdays between 8 AM and 9 AM lasted 63 seconds on average.
In the **Unique Numbers** tab, each person is counted once per hour. Their completed calls in that hour are averaged first, so one person you called many times does not outweigh everyone else.
**Use it to:** check the Best Day and Hour to Call chart. Times with both a high percentage there and a long average here are your strongest calling windows.
***
## Reading tips
* **All times are in IST.** Column **06** is 6 AM and column **18** is 6 PM. The columns run from **06** to **22** (10 PM). On smaller screens, scroll the grid sideways to see the last columns.
* **Blank cells mean too few calls.** A cell shows a value only when that day and hour has more than 200 completed calls (more than 200 people in the **Unique Numbers** tab). With fewer calls, the number would not be reliable.
* **Filters apply to every chart.** Change a filter at the top and all charts update.
* **Not sure what a chart shows?** Hover the small **i** (info) icon next to its title for a short description.
***
## Next Steps
Drill into individual calls, recordings and transcripts
Schedule calls for the best days and hours
Limit the hours your agent can make outbound calls
Place calls through your own phone lines
For example, the cell for **Wed** at **08** shows **63**. That means completed calls on Wednesdays between 8 AM and 9 AM lasted 63 seconds on average.
In the **Unique Numbers** tab, each person is counted once per hour. Their completed calls in that hour are averaged first, so one person you called many times does not outweigh everyone else.
**Use it to:** check the Best Day and Hour to Call chart. Times with both a high percentage there and a long average here are your strongest calling windows.
***
## Reading tips
* **All times are in IST.** Column **06** is 6 AM and column **18** is 6 PM. The columns run from **06** to **22** (10 PM). On smaller screens, scroll the grid sideways to see the last columns.
* **Blank cells mean too few calls.** A cell shows a value only when that day and hour has more than 200 completed calls (more than 200 people in the **Unique Numbers** tab). With fewer calls, the number would not be reliable.
* **Filters apply to every chart.** Change a filter at the top and all charts update.
* **Not sure what a chart shows?** Hover the small **i** (info) icon next to its title for a short description.
***
## Next Steps
Drill into individual calls, recordings and transcripts
Schedule calls for the best days and hours
Limit the hours your agent can make outbound calls
Place calls through your own phone lines